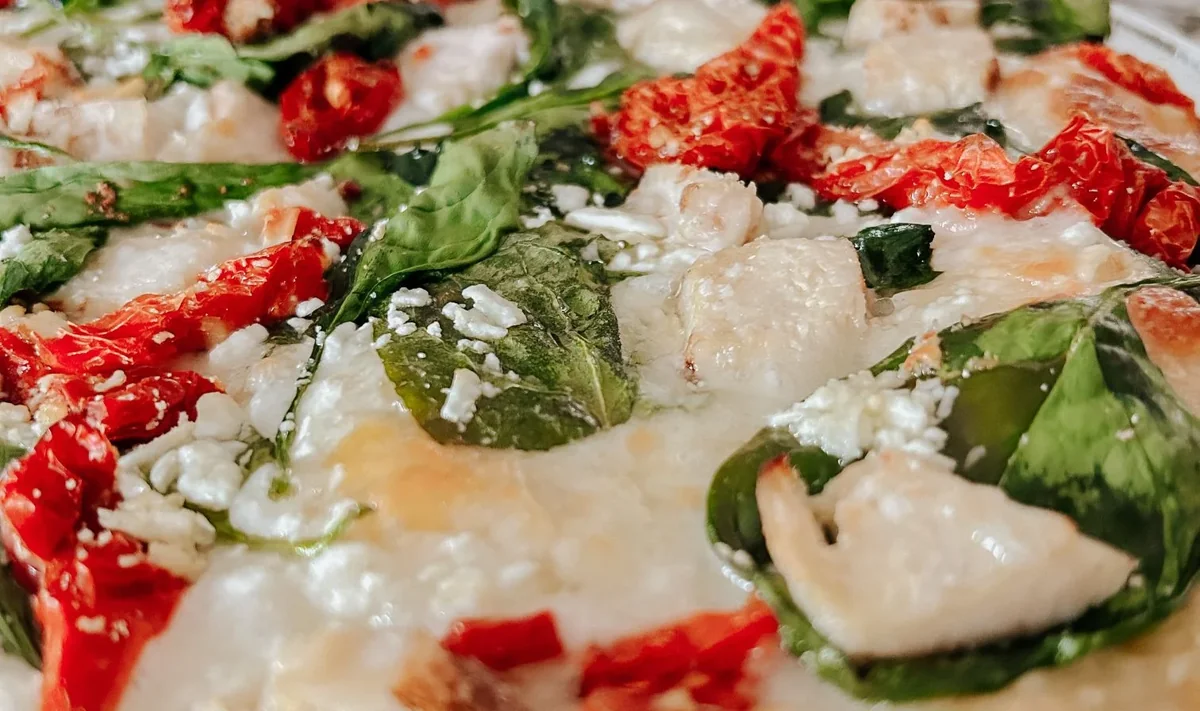

Papa Murphy's Take N' Bake: Two-Phase Influencer Traffic and Conversion Campaign
UGC ProductionThe Shelf built a two-phase influencer traffic and conversion campaign for Papa Murphy's across Instagram, TikTok and Meta paid media, reporting $334K+ in total purchase value.
Case in 60 seconds
Papa Murphy's needed to increase visibility and drive revenue through influencer content across organic and paid channels, with the pressure concentrated in Q4 tentpole moments that had to carry the Everyday Value Menu, the Jack-O Pizza and seasonal limited-time offers.
The campaign appears to turn on the reading that a take-and-bake pizza is bought as a solution to a weeknight problem rather than as a treat, so content showing the empty fridge and the family dinner scramble carried more purchase intent than product photography would.
The organizing thesis was to position Papa Murphy's as the most craveable no-fuss dinner hack on the internet, with creators showing how the product fit into real life rather than filming what they ordered.
The Shelf activated nano, micro and mid-tier creators on Instagram and TikTok in a traffic phase using allowlisted content, then retargeted those audiences with conversion-optimized creative on Meta paid media built from the strongest hack and review assets.
The Shelf reports 3.8M Impressions (↑80% over goal), 71.9K link clicks, 11.6K tracked purchases via Meta Pixel, $334K+ in total purchase value and a $0.96 CPA, with @johneatscheap driving 65% of campaign sales and $192K in revenue.
Strategy Breakdown
The primary strategy-learning section — interpretation, not a press-release summary.
Creative & Execution System
Assets & channels
- Meta Paid Media
- TikTok
- IG carousel
- Instagram Reels & Stories
- Instagram in-feed posts
- TikTok videos
- UGC
- hack content
- hosting moments
- lifestyle content
- product demos
Partners
- The Shelf (lead_agency)
Creator role
- Emily Carriveau — creator
- John — creator
- Rosie Piper — creator
- Safi — creator
- nano, micro, and mid-tier creators across Instagram and TikTok
Results & Evidence
| Metric | Value | Result type |
|---|---|---|
| average order value, top creator | With the highest AOV of $28.98 and a 1.24% CTR | revenue |
| click-through rate, traffic phase | 2.66% CTR (traffic phase) | 0.99% CTR (conversion phase) | performance |
| cost per acquisition | $0.96 CPA | performance |
| cost per landing page view | $1.24 CPLPV (Cost per Landing Page View) from top performer @smalltownme | traffic |
| customer purchases, top creator | His TikTok review of the Cheesy Stuffed Crust pizza delivered 6.6K customer purchases | conversions |
| engagement rate, IG carousel | Safi's IG carousel spotlighted a joyful post-dinner moment with her kids and dessert-earning an impressive 27.16% engagement rate | engagement_rate |
| impressions | 3.8M Impressions (↑80% over goal) | performance |
| landing page views | 22.2K landing page views during traffic phase | traffic |
| link clicks | 71.9K link clicks across traffic and conversion phases | traffic |
| post shares | And over 500 post shares. | performance |
| purchase value, @smalltownme | She delivered $17.8K in purchase value with an average order of $28.81 | revenue |
| return on ad spend | 879% return on ad spend (ROAS) | roi |
| share of campaign sales, top creator | @johneatscheap drove 65% of campaign sales - $192K in revenue | performance |
| share of traffic phase LPVs | @smalltownme delivered 49% of traffic phase LPVs - 10.6K LPVs | performance |
| sticker taps | 43 sticker taps tracked from Stories | performance |
| total purchase value | $334K+ in total purchase value | revenue |
| tracked purchases | 11.6K tracked purchases via Meta Pixel | conversions |
| video view rate by phase | 13.4% → 23.84% VTR increase between phases | performance |
| video views, traffic phase | 318K video views (traffic) | 202.9K video views (conversion) | video_views |
Why The Shelf Influencer Marketing Agency's strategy worked
- 1
Sequencing traffic content ahead of retargeting appears to compound creative performance, because The Shelf reports a 13.4% video view rate in phase one rising to 23.84% VTR in phase two on audiences already exposed to the first wave.
- 2
Creator-product fit concentrates returns rather than spreading them, since one creator, @johneatscheap, drove 65% of campaign sales and $192K in revenue while the roster spanned nano through mid-tier.
- 3
Platform choice reads as a function of content mode rather than audience size, because TikTok delivered 2x engagement against Instagram on hack and demonstration content while Instagram carried lifestyle and evergreen material.
- 4
Traffic efficiency and revenue efficiency can sit with different creators, given that @smalltownme delivered 49% of traffic phase LPVs at a $1.24 CPLPV while the conversion weight sat elsewhere in the roster.

Results
1.7M
Engagements
41.1M
Impressions
145%
Assets delivered
Results
+700
Claims per day
11%
Sales increase
800%
Claims increase vs traditional insurers